
|
Reports - Overview |
|
iLeap Platform's Report Designer offers a powerful platform to efficiently design any 'Business Intelligence' report that meets the specific needs of enterprises. The visual Report Designer supports a rich set of features to help you design reports that presents a compelling display of your report data. With its user-friendly interface, you can create/design robust reports that include data from multiple types of data sources. It also comes with a variety of standard (pre-defined) reports to serve your business requirements aptly. |
|

| Contents |

| Creating a new Report |
|
Report Designer allows you to create insightful reports. Using the designer, you can easily convert your raw data into meaningful & expressive reports which are of business value. With the powerful report designer, you can primarily create/design an array of reports based on the following report types:
|
| To create a new report, follow these steps: |
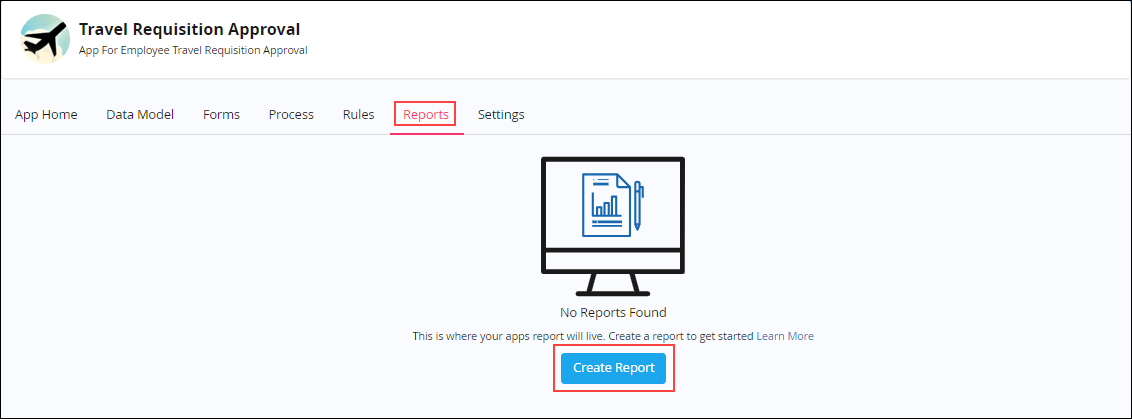
1. On the Reports tab, click Create Report.
2. The New Report dialog box appears.
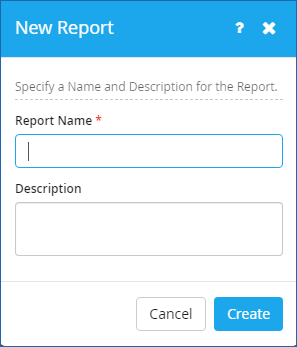
- Enter the name of the report in the Report Name box.
- Enter an appropriate description for the report in the Description box.
3. Click Create. The Report Data Configuration dialog box appears.
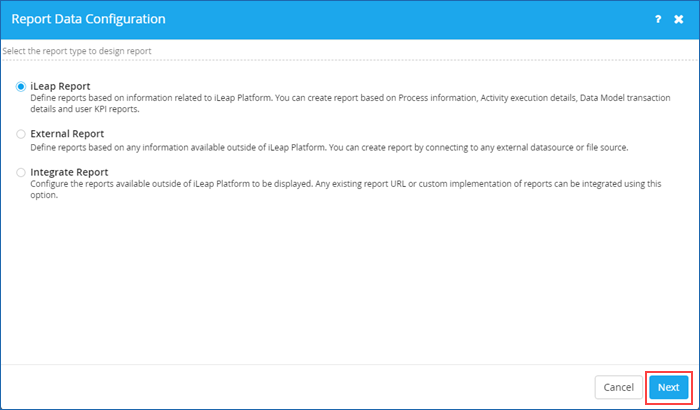
Configuring Various iLeap Reports :
- Select the type of report on which you wish to design your report on. iLeap Report report type is selected by default.
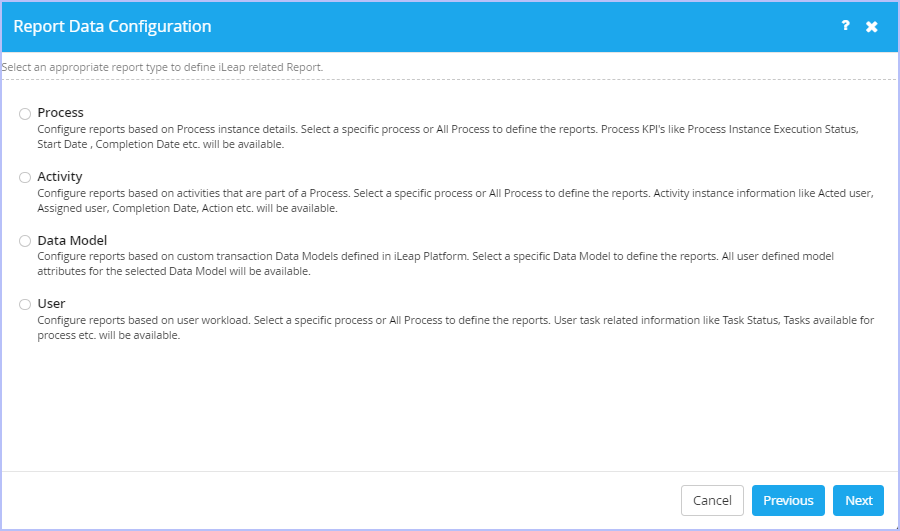
4. Click Next. Select an appropriate iLeap report type on which you wish to create/define an iLeap related report.
iLeap reports are further classified into the following based on the report type.
- Process - select this report type to configure your iLeap reports (both summary & detailed) based on the process instance details. For more information, see process based reports.
- Activity - select this report type to configure your iLeap reports (both summary & detailed) based on the process activities. For more information, see activity based reports.
- Data Model - select this report type to configure your iLeap reports based on custom transaction data models defined in iLeap Platform. For more information, see data model based reports.
- User - select this report type to configure your iLeap reports(both summary & detailed) based on user workload. For more information, see user based reports.
- If the report type selected is Process, then select the name of specific Process from the drop-down list. For example, Travel Requisition Approval.
- Click the type of report you wish to view. The options are: Summary Report (Default) & Details Report .
5. Click Next. Click Previous if you wish to review any details specified earlier.
- Specify the filtering data on which the Process report to be designed based on condition.
- Set the conditions as required from their respective fields. The available filter conditions are (For Details Report):
| And/Or | Field | Operator | Type |
| AND | CompletedOn | = | Value |
| OR | SubmittedOn | != | Field |
| ProcessName | < | Today | |
| ReferenceNumber | < = | Today - 7 Days | |
| StatusName | > | Today - 15 Days | |
| SubmittedBy | >= | Today - 30 Days | |
| TimeTakenForExecution | IS NULL | Today - 2 Month | |
| IS NOT NULL | Today - 3 Month | ||
- Click the Add filter icon to add the specified filter condition. You can add any number of valid filter conditions.
- Click the Clear filters to clear all the filter conditions specified at once & start afresh.
6. Click Next. Based on the report option specified earlier, a preview of the report displaying the top 25 records appears.
- Scroll vertically down to view all the remaining fields.
- Scroll horizontally to the right to view all the remaining fields.
7. Click Finish.
In the page displayed, notice that the reporting field controls appear on the left pane. You can drag & drop any of these field controls on to the Rows, Columns & Values area as per your design requirements.
- You can remove the field controls dropped onto the Rows, Columns & Values area as per your requirements as well.
For e.g click on the field control 'CompletedOn', to remove this particular field.
- You can also re-arrange the fields in any order you wish to.
- Click on any field control & change its display name from the Field dialog box displayed. For example, the display name of field 'ProcessName' is modified to 'Process Name'. Click Apply.
Similarly, If you click on any field control available from the Values area, the Field dialog box appears. (e.g. 'CompletedOn' field).
Notice that an additional value field 'Aggregate Function' is displayed based on the data type of the 'CompletedOn' field.
8. On the toolbar, click the  icon to display the available chart types for the report.
The following chart types are available in the Report Designer.
| Line Chart | Bar Chart | Stacked Bar Chart | Area Chart | Scatter Chart | Pie Chart | Spline Chart | Donut Chart | Gauge Chart | Step Chart | Area-Step Chart | Table(selected by default) | Pivot Table |
9. Click the  icon on the toolbar to Save this report. Else, click the
  icon to Publish this report at once. For more information on the options available on the toolbar, see Toolbar options.
10. Immediately, ‘Success! Report saved successfully’ message is displayed at the top, if you choose to save the report, else ‘Success! Report published successfully’ message is displayed, if you choose to save & publish in one go.
11. The newly created report is displayed on the Reports page.
|
Fields marked with * are mandatory. |
Once the report is created, you can design your report as per your requirements in the report designer.

| Previous | Back to Contents | Next |
You can save the iLeap reports created based on based on process instance details in MS-Word & Portable Document Format (PDF) formats while previewing it.
- On the toolbar, click the
 icon to preview the selected report.
- Select either PDF or Word from the Save Report Document drop-down list.
- The report would be generated in the format chosen & would be available in the 'Downloads' folder on your local system.
- Click the
 icon to navigate back to the Report Designer mode.

| Previous | Back to Contents | Next |
|
You can configure iLeap reports based on the activities that are part of the process. To configure a iLeap report based on the activity, please refer to the step-by-step procedure described above for the report type 'Process', since the procedure for creating/defining an iLeap report based on the report type (Process/Activity/Data Model/User) is very much similar. (steps 3 to 11). For the selected sample process 'Travel Requisition Approval' with the report name 'Employee Travel Report - Activity Based', a preview of the report (validated data before importing) appears as shown below. |
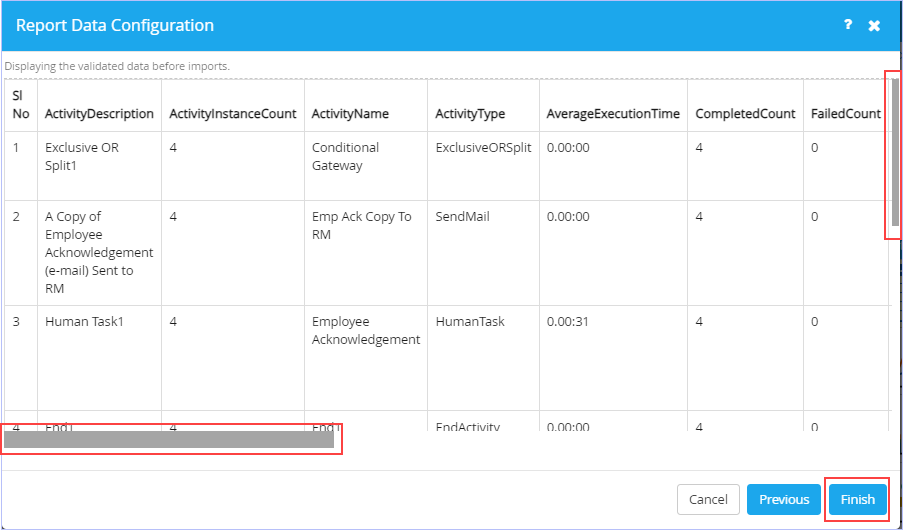
Summary Activity Report (Preview)
You can scroll horizontally as well as vertically to view all the remaining fields.
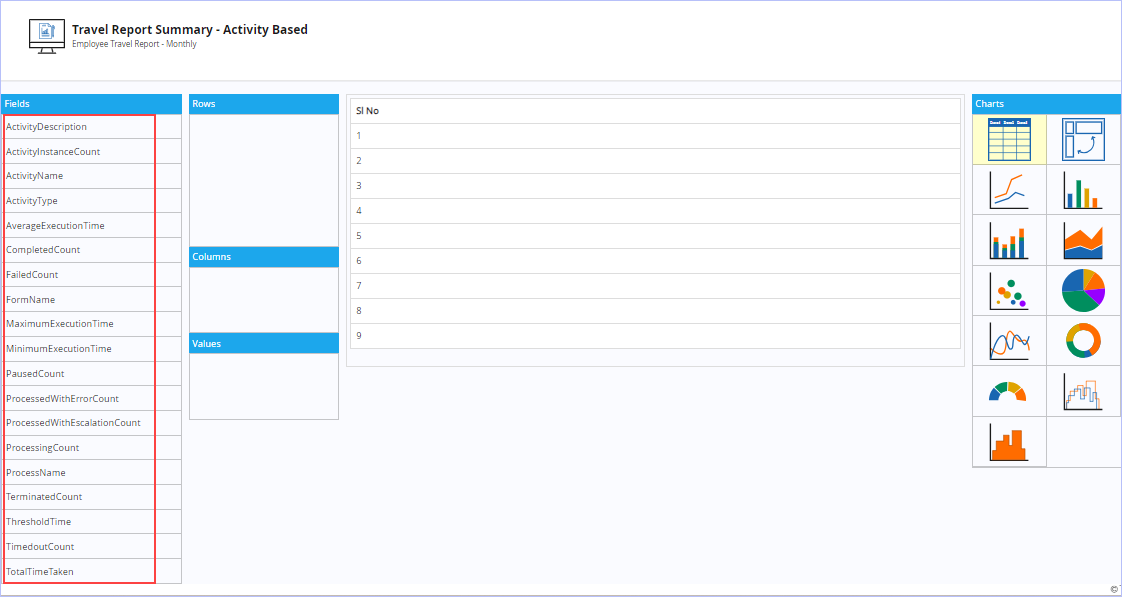
Notice the reporting field controls that appear on the left pane for the selected report type 'Activity'. You can drag & drop any of these field controls on to the Rows, Columns & Values area as per your design requirements.
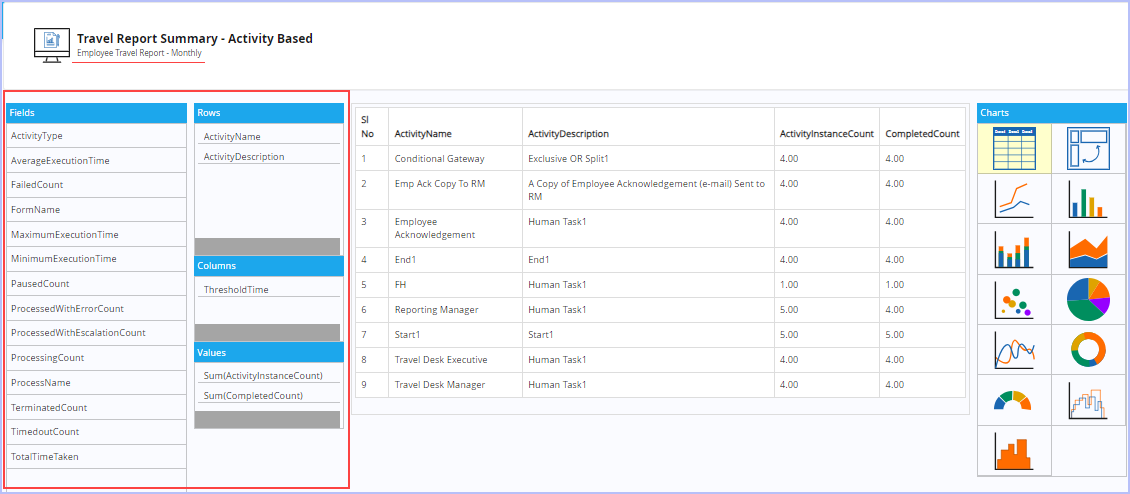
Sample Summary Report created based on Activity details is shown below (Tabular format).


| Previous | Back to Contents | Next |
|
You can configure iLeap reports based on custom transaction data models defined in iLeap Platform. All the user defined model attributes for the selected data model are available to design the report as per your requirements. To configure a iLeap report based on the Data Model, please refer to the step-by-step procedure described above for the report type 'Process', since the procedure for creating/defining an iLeap report based on the report type (Activity/Data Model/User) is very much similar. (steps 3 to 11). For the selected sample data model 'Travel Requisition Information' with the report name 'Travel Report - Data Model Based', a preview of the report (validated data before importing) appears as shown below. |
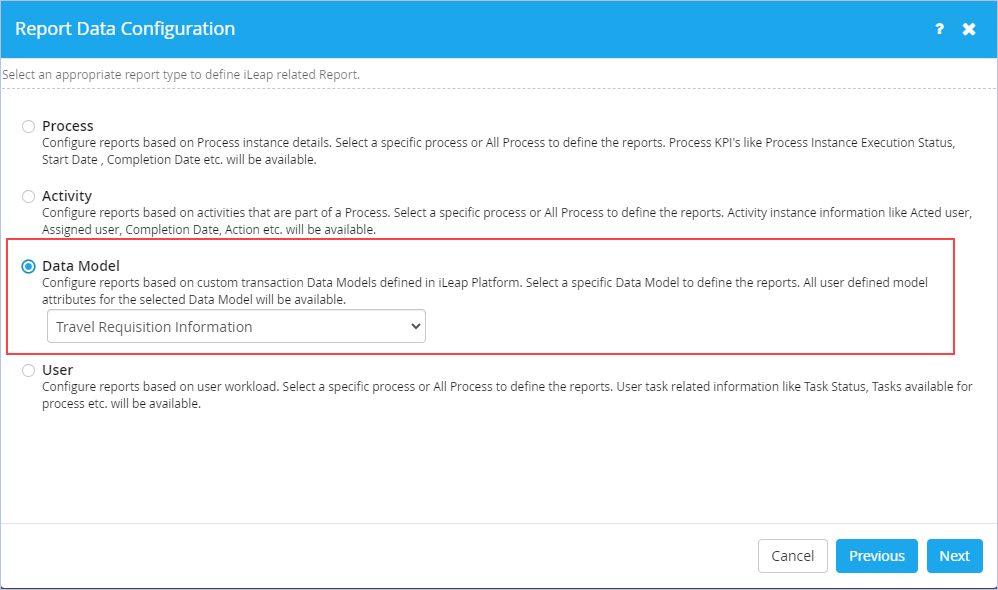
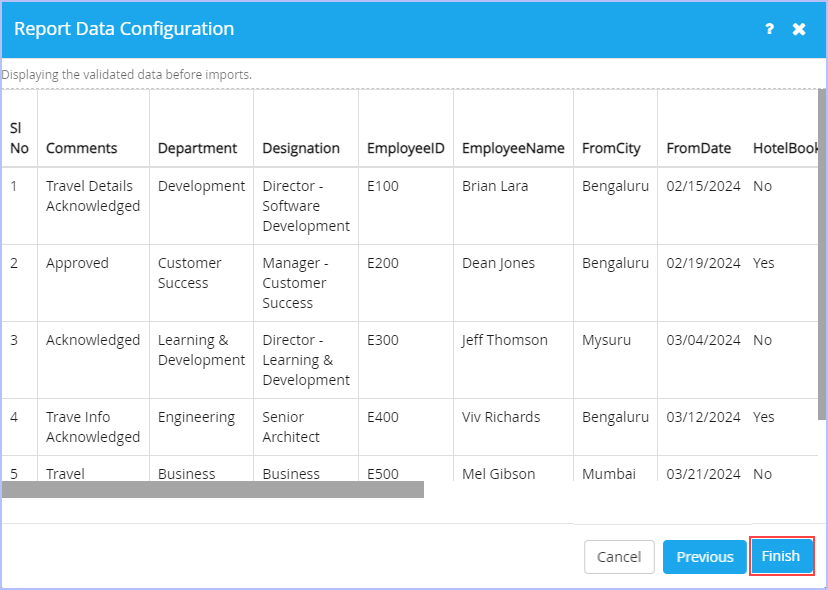
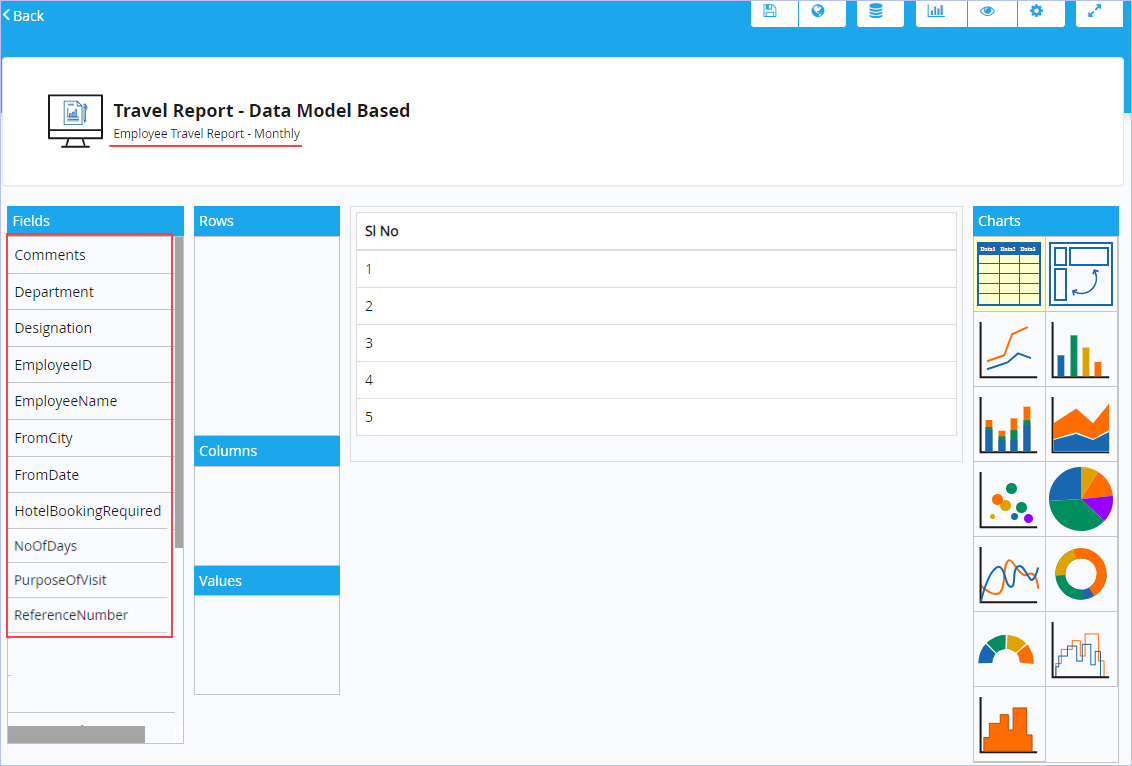
Notice the reporting field controls (based on the selected data model) that appear on the left pane for the selected report type 'Data Model'. You can drag & drop any of these field controls on to the Rows, Columns & Values area as per your design requirements.
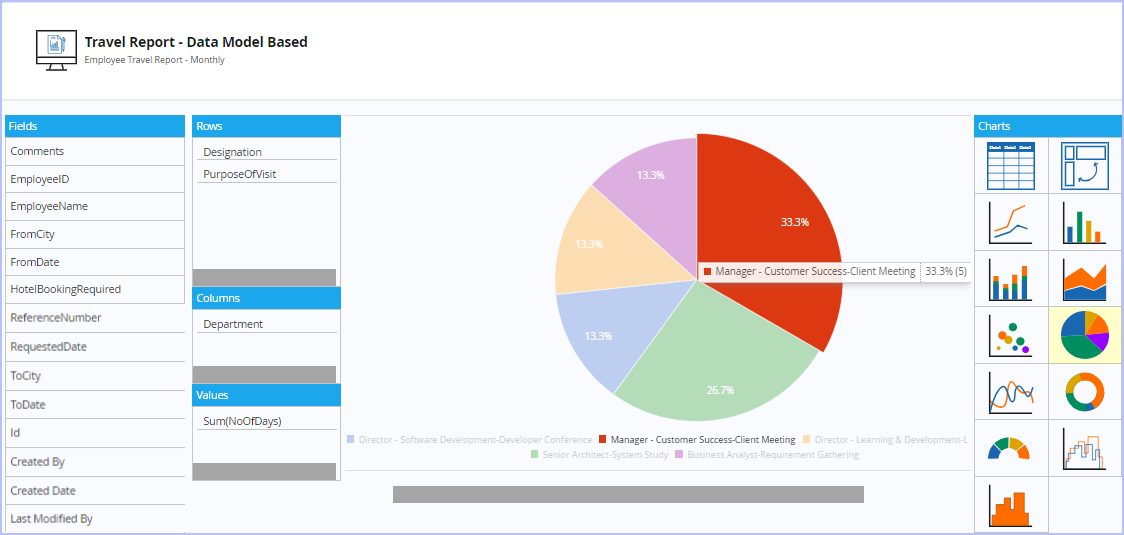
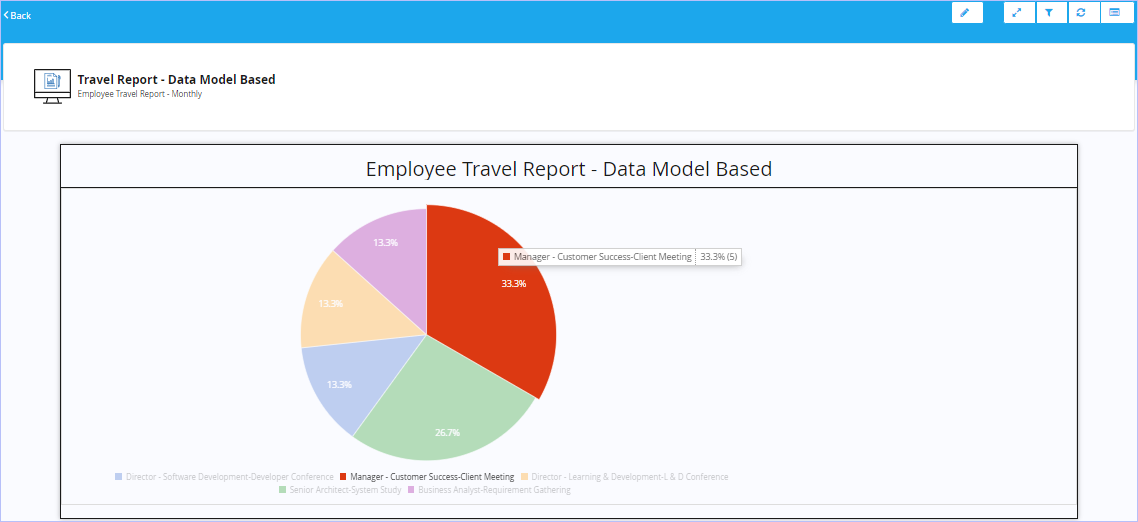
Sample Report created based on Data Model transaction details is shown below. (Pie- Chart)

| Previous | Back to Contents | Next |
|
You can configure iLeap reports based on the user workload/KPIs. To configure a iLeap report based on the User, please refer to the step-by-step procedure described above for the report type 'Process', since the procedure for creating/defining an iLeap report based on the report type (Process/Activity/Data Model/User) is very much similar. (steps 3 to 11). For the selected sample process 'Travel Requisition Approval' with the report name 'Employee Travel Report - User Based', a preview of the report (validated data before importing) appears. |
- Scroll horizontally to the right to view all the remaining fields.
Notice the reporting field controls that appear on the left pane for the selected report type 'User'. You can drag & drop any of these field controls on to the Rows, Columns & Values area as per your design requirements.
- Scroll horizontally to the right to view all the remaining fields.

| Previous | Back to Contents | Next |
| Report Design Area |
|
This is the primary area that appears as soon as the report data options are configured after the display of validated data before imports for the report type you wish to create and design. You can simply drag & drop the list of report fields that appear on the left pane on to the Rows, Columns and Values fields as required. The corresponding report fields form the report structure in a tabular format by default. Various diverse types of charts are displayed on the right pane. You can choose any of the chart type by just clicking on it so as to display the report data as per the selected chart type. You can also display your designed Report(es) in either List View or Tile View. You can switch or toggle between any of these views any time. |
| To toggle between the displays of your Reports, follow these steps: |
- On the Reports tab, click
 .
.

| Previous | Back to Contents | Next |
| Setting Report Properties |
| Report Designer allows you to set few generic properties of a Report through the Report Properties dialog box. |
| To set Report properties, follow these steps: |
1. Open any report for which you wish to set the properties.
2. On the toolbar, Click the ![]() icon. The Report Properties dialog box appears.
icon. The Report Properties dialog box appears.
3. Click the Generic tab. Set the generic properties of the report as shown.
- Modify the name of the report as you wish to in the Report Name box.
- Key in/Modify the name of the report heading as appropriate in the Report Heading box.
- Modify the description as you wish to in the Description box.
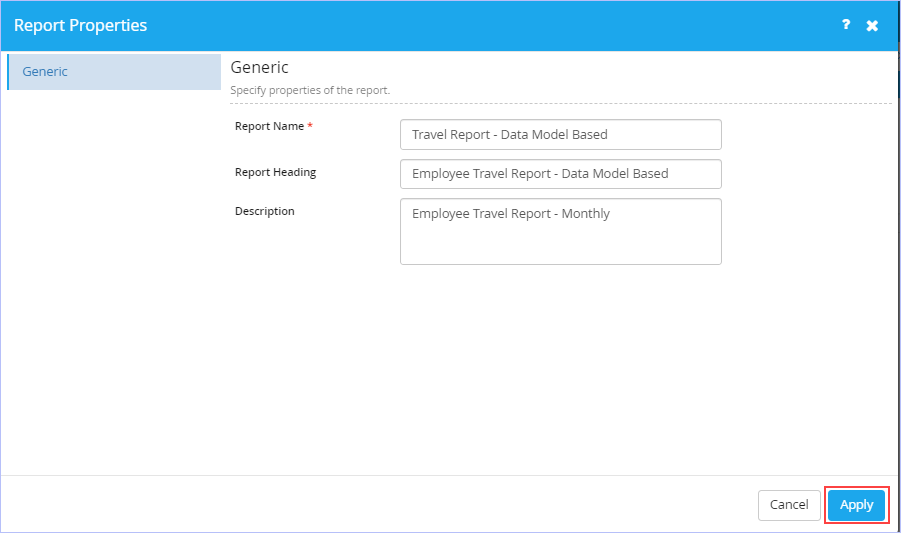
3. Click Apply.
|
|

| Previous | Back to Contents | Next |
| Editing a Report |
|
You can edit a report at any time even after its publication as well. |
| To edit a report, follow these steps: |
1. On the Reports page, hover the mouse pointer over any published report you wish to edit & click the Edit Report icon as shown.

2. Make the requisite modifications & then save or publish the report as you wish to.

| Deleting a Report |
|
A report once published cannot be deleted. It can only be deleted in its draft/editable state before being published. |

| To | Action |
| Edit Report | Click  |
| Save Report | Click  |
| Publish Report | Click  |
| Configure Report Data | Click  |
| Show Chart Types | Click  |
| Preview Report | Click  |
| Filter Report Fields | Click  |
| Export to CSV Format |
Click |
| View Report in Full Screen | Click  |
| Set Report Properties | Click  |
| Get back to Report Designer Mode | Click  |

| Previous | Back to Contents | Next |
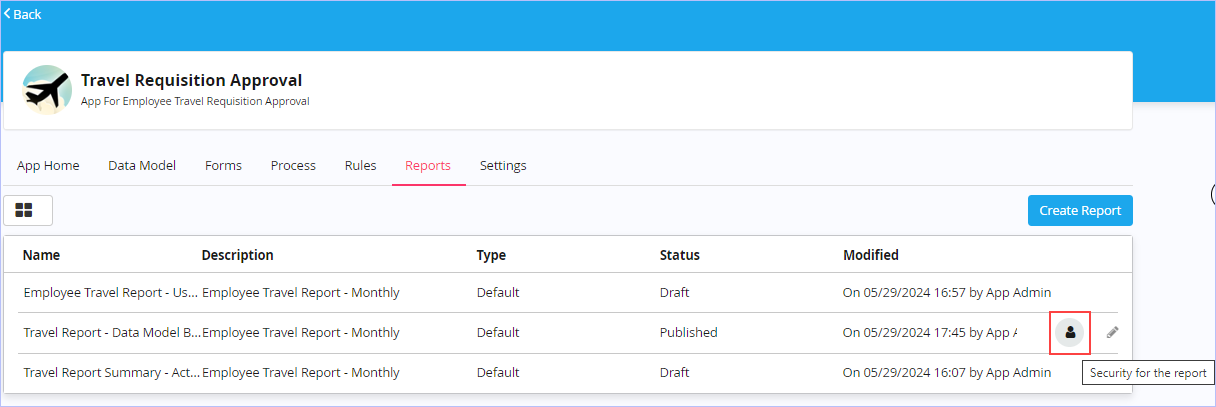
1. On the Reports page, hover the mouse pointer over any published report & click the Security for the Report icon as shown.
2. The Security dialog box appears as shown. Notice that all the roles we had created for this sample app are displayed.
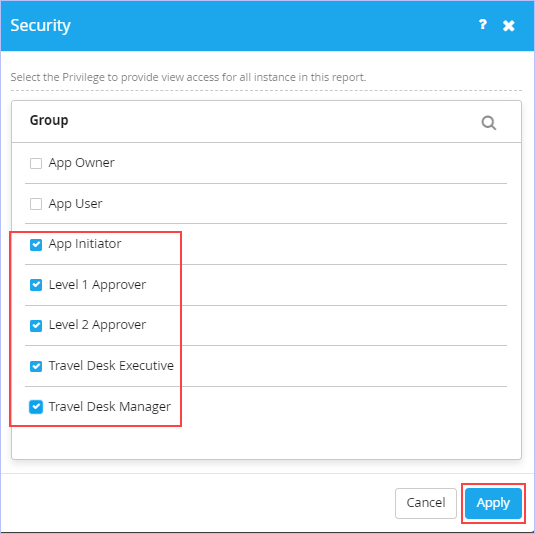
3. Select the roles for which you wish to provide view access for all the instances of this report & click Apply. Immediately, a message 'Success! Privilege applied successfully' appears.

| Previous | Back to Contents |
